The wrong things take too much time
Central teams spend weeks requesting spreadsheets from schools
Smarter Analytics delivers ready-made and bespoke dashboards, designed for educators and built for impact. Fast to deploy, simple to use, and tailored to your context — so every metric leads to action, not noise.
From attendance to finance, Smarter Analytics gives MAT leaders consistent, comparable, and strategic data across every school — in one platform.
“Trusts report the greatest challenges in ensuring consistency of data across schools.”
– DfE Trust Capacity Report
Growth brings complexity — and opportunity
Central teams spend weeks requesting spreadsheets from schools
Data arrives late, incomplete, or in clashing formats
Different MIS across academies means no shared definitions or methods.
Schools feel the strain — while trust leaders lack the clarity they need for strategic oversight.
One methodology across the trust — even with mixed MIS systems
Every school sees the same layouts, metrics, and definitions.
Compare schools, phases, cohorts, or trust averages instantly.
Data refreshes without schools doing anything.
No version confusion, no mismatched figures.
Stop chasing spreadsheets. Reduce workload in schools. Give your trust the clarity it needs to lead.
Smarter Analytics supports all school data, but these are the areas MAT leaders prioritise first.
Standardised, trust-wide reporting across all schools — even when MIS differ. Spot persistent absence, compare across cohorts, and see trends early.
National Benchmarking
Consistent View
Pupil Target Lists
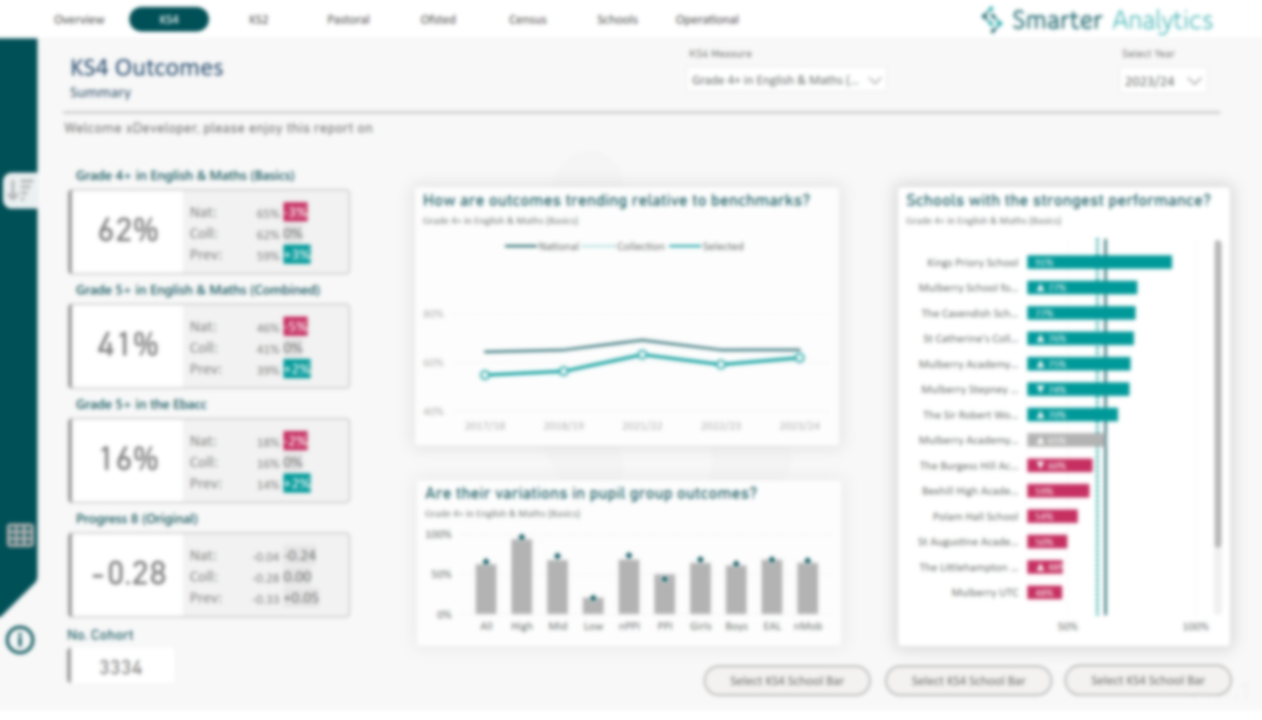
Unified metrics across academies. Understand school and phase performance instantly, from headline results to subgroup analysis.
National Benchmarking
Consistent View
Group Drilldown
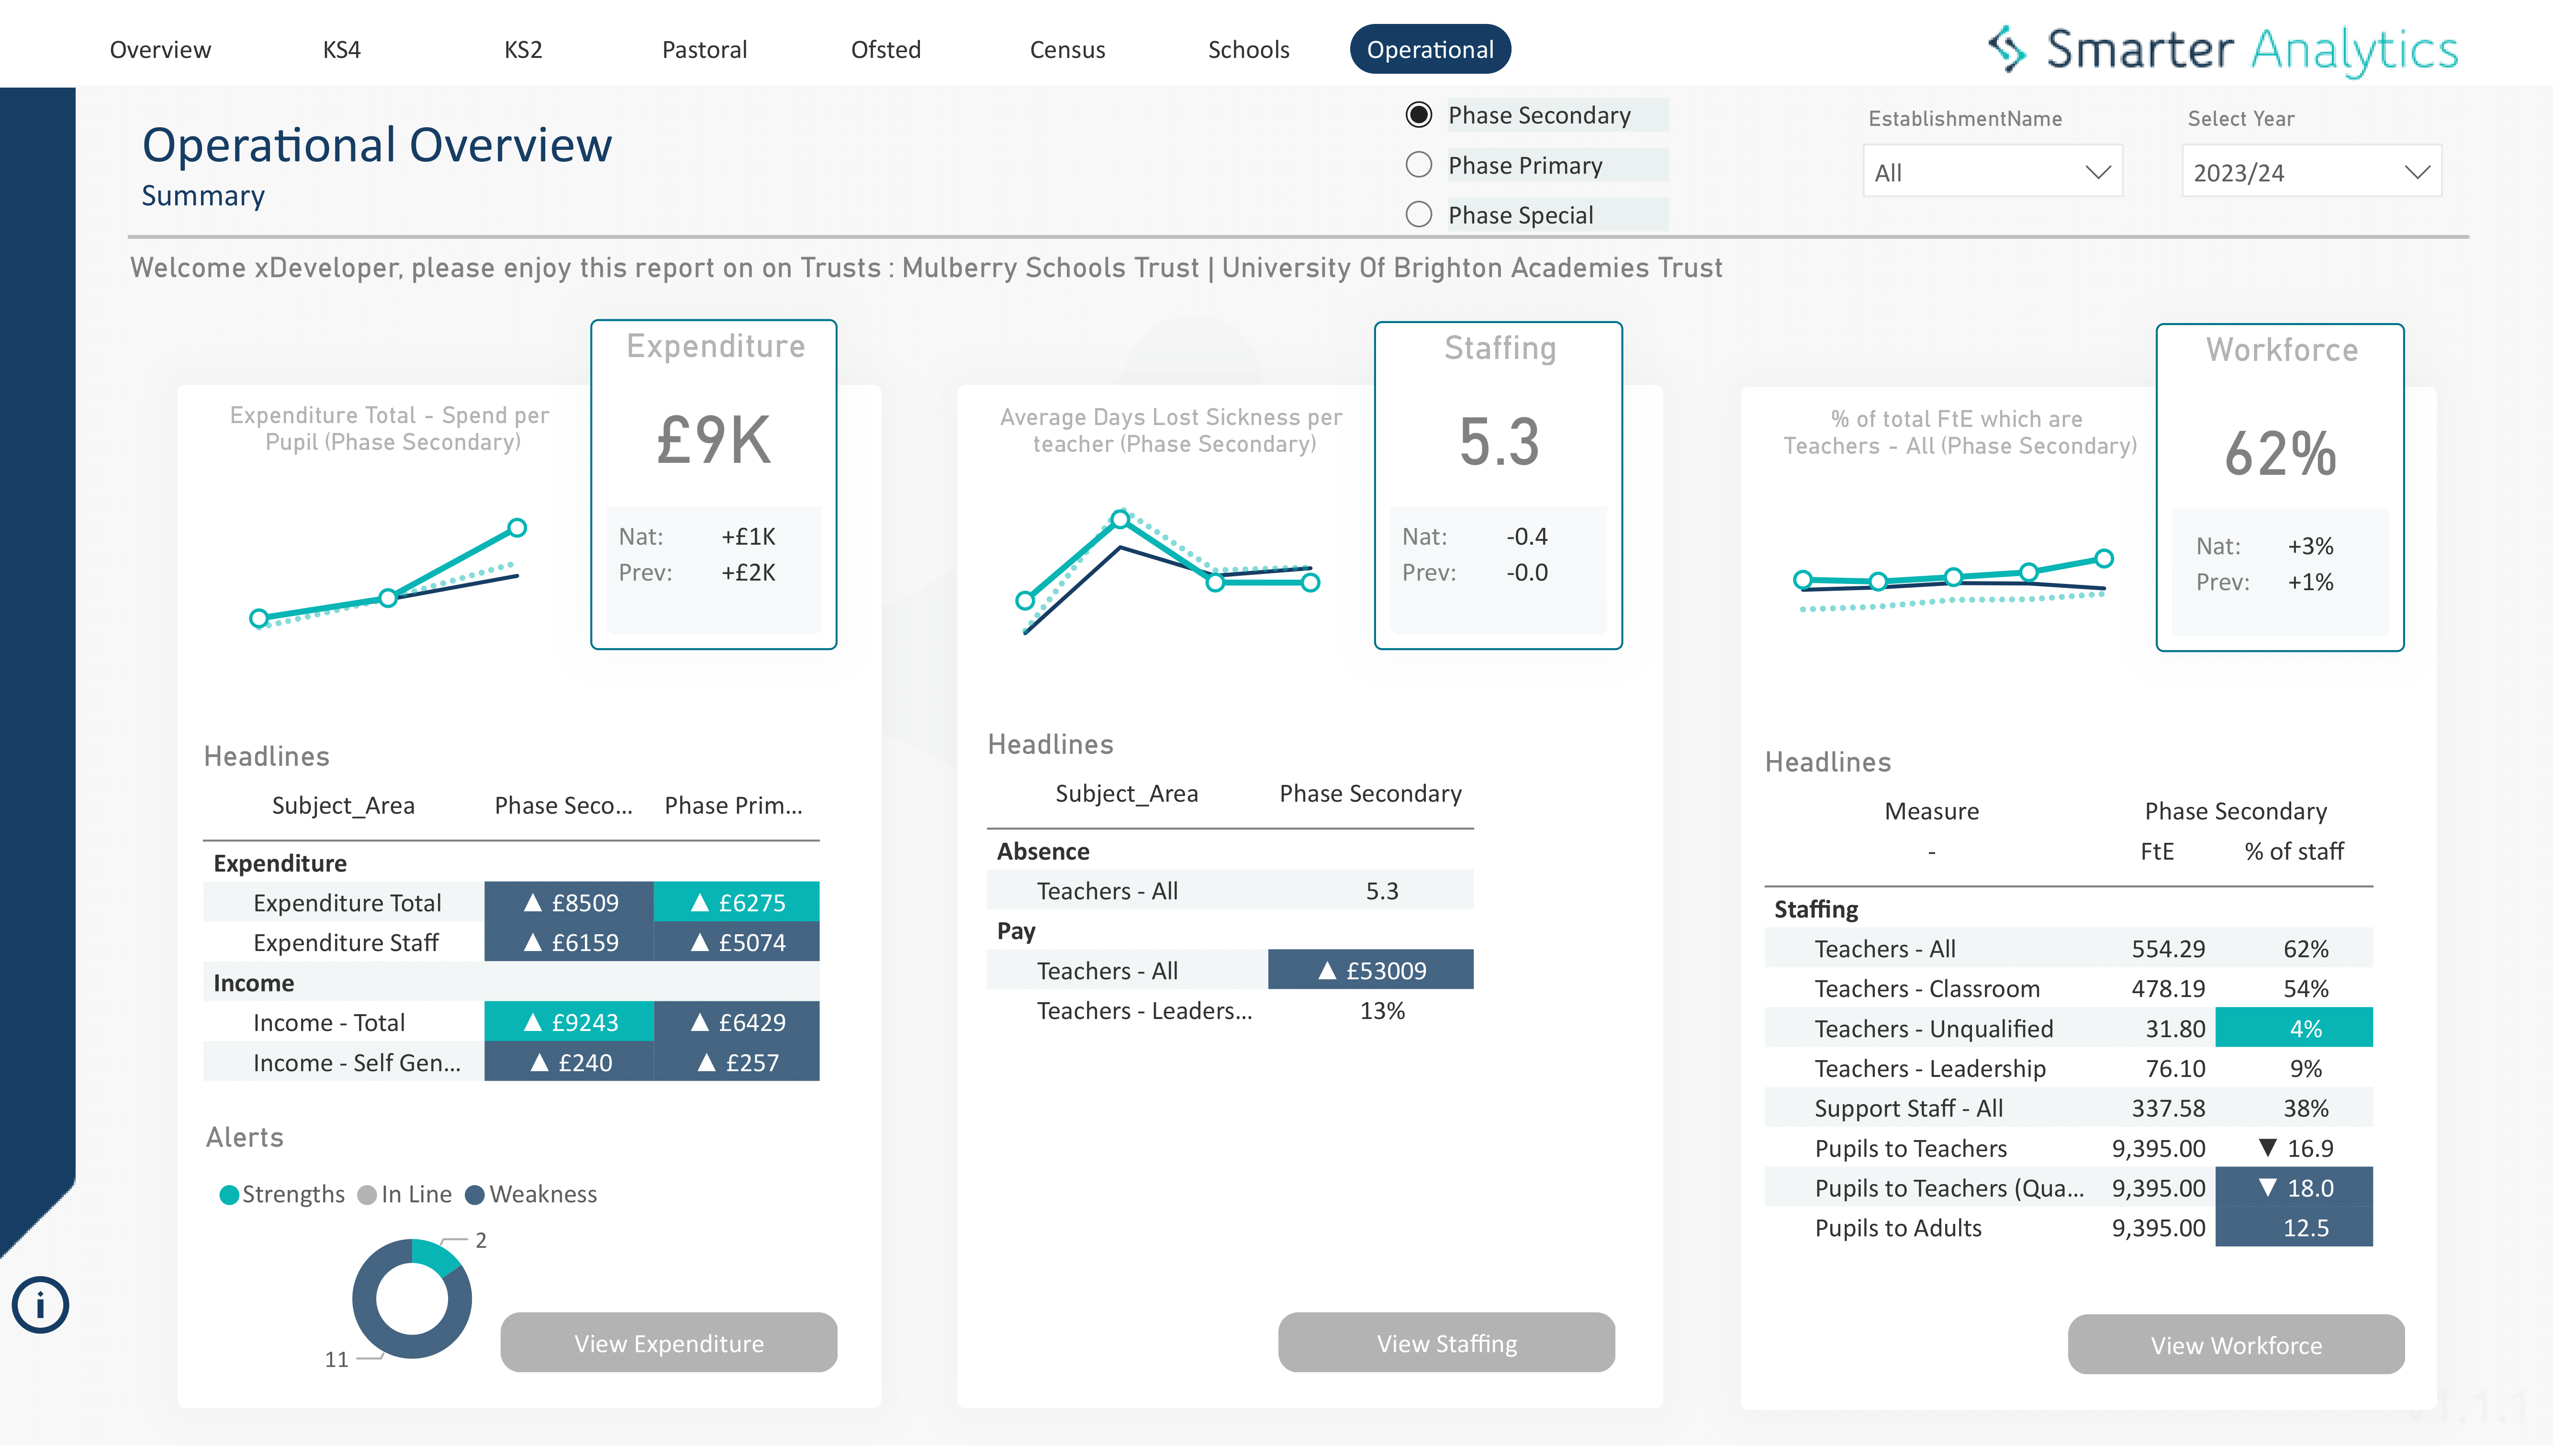
View workforce, training, and pay gap data alongside outcomes. Connect resourcing with results to inform sharper decisions.
National Benchmarking
Consistent View
Group Drilldown
Scale with your trust’s needs
Quick insights from classroom visits and quality assurance checks.
Capture voice, wellbeing, and perceptions across the school.
Track participation, impact, and alignment with priorities.
Provide governors and SLT with timely safeguarding insights.
Flexible dashboards that grow with your school’s needs.
Smarter Analytics unifies your schools’ data into one clear, strategic view.
