The wrong things take too much time
Staff spend time building Excel packs instead of planning strategy.
Smarter Analytics delivers ready-made dashboards, designed for educators and built for impact. Fast to deploy, simple to use, and tailored to your context — so every metric leads to action, not noise.
Ready-made dashboards for assessment, attendance, exclusions, and behaviour — saving SLT hours and giving governors and Ofsted clear answers.
“Nearly half of school leaders say their data systems create stress, not solutions.”
– DfE Workload Survey, 2023
When systems don’t connect, the wrong things take too much time — and leaders lose clarity where it matters most.
Staff spend time building Excel packs instead of planning strategy.
Numbers change between pastoral teams, SLT, and classroom staff
Behaviour in one system, assessment in another, with no easy way to join the dots.
Preparing meaningful evidence of trends is resource-heavy.
Smarter Analytics dashboards save time, reduce stress, and give leaders the clarity to act with confidence.
Dashboards update automatically — no more copying, pasting, or chasing.
Pages are structured like lessons — questions first, data second.
National averages, trust comparisons, and significance highlight what really matters.
SLT, governors, and middle leaders all see the same, up-to-date version.
Smarter Analytics delivers clarity across the areas schools rely on most — each designed to guide decisions, not overwhelm with data.
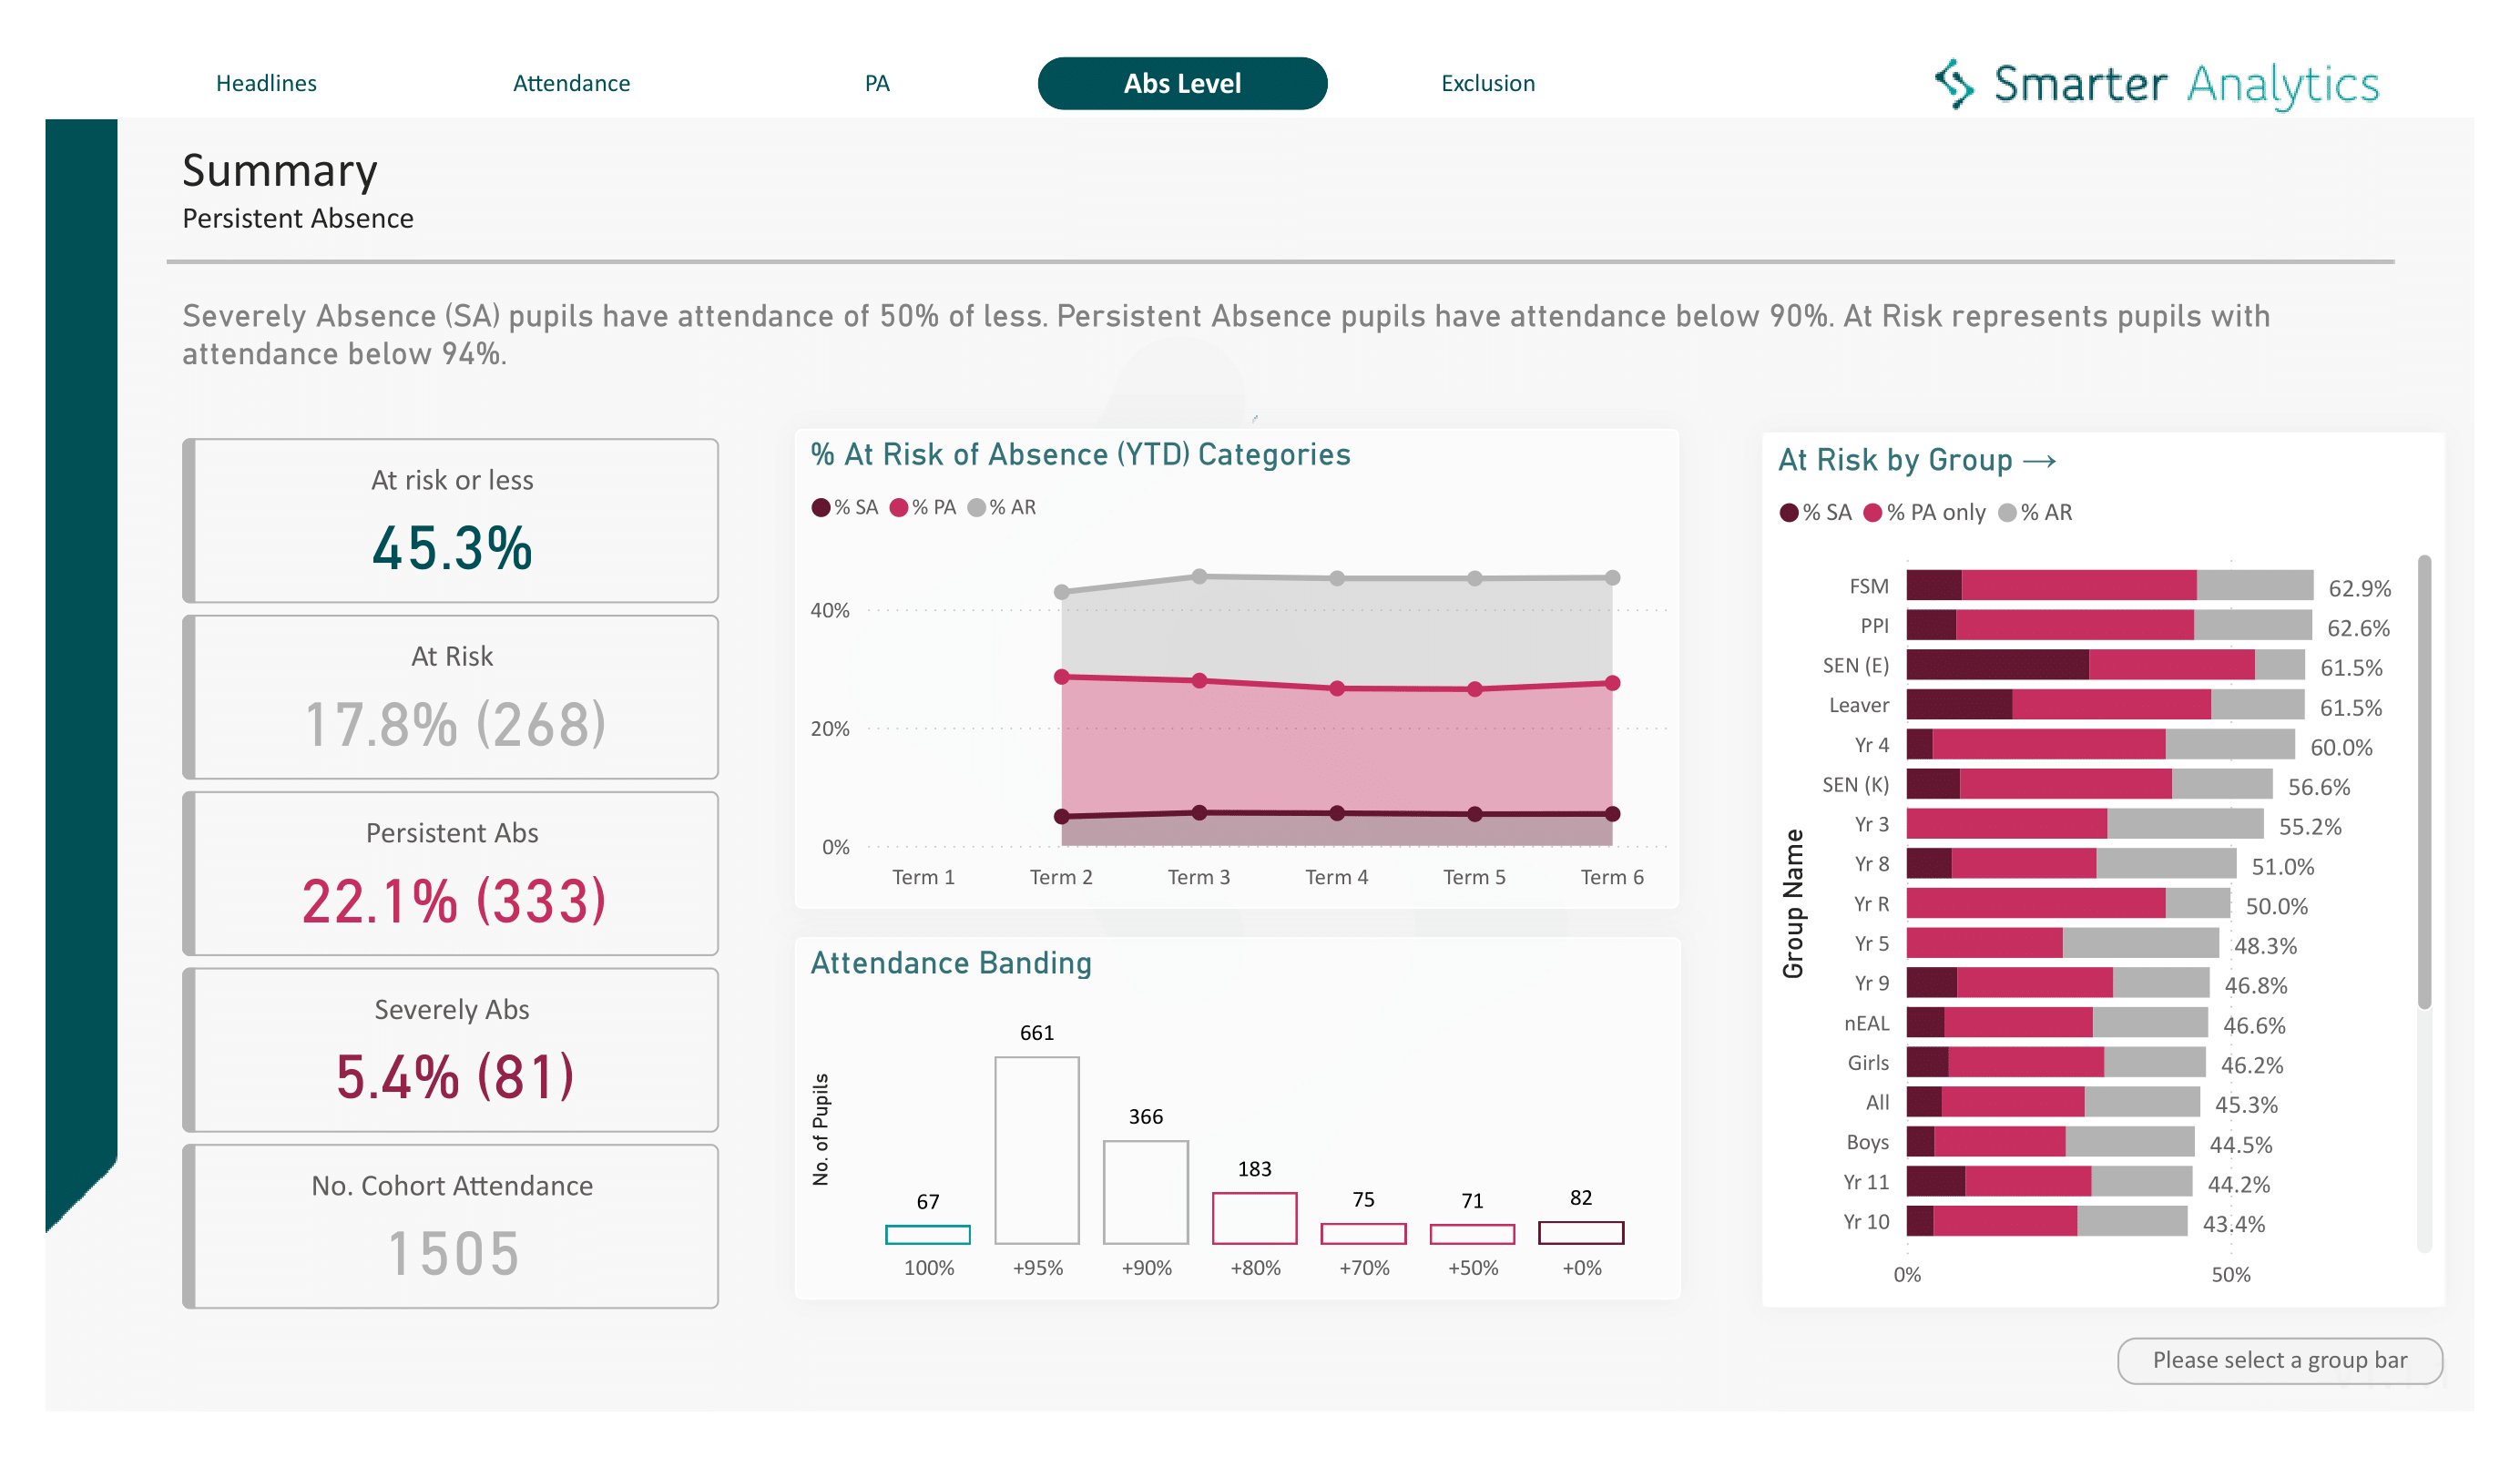
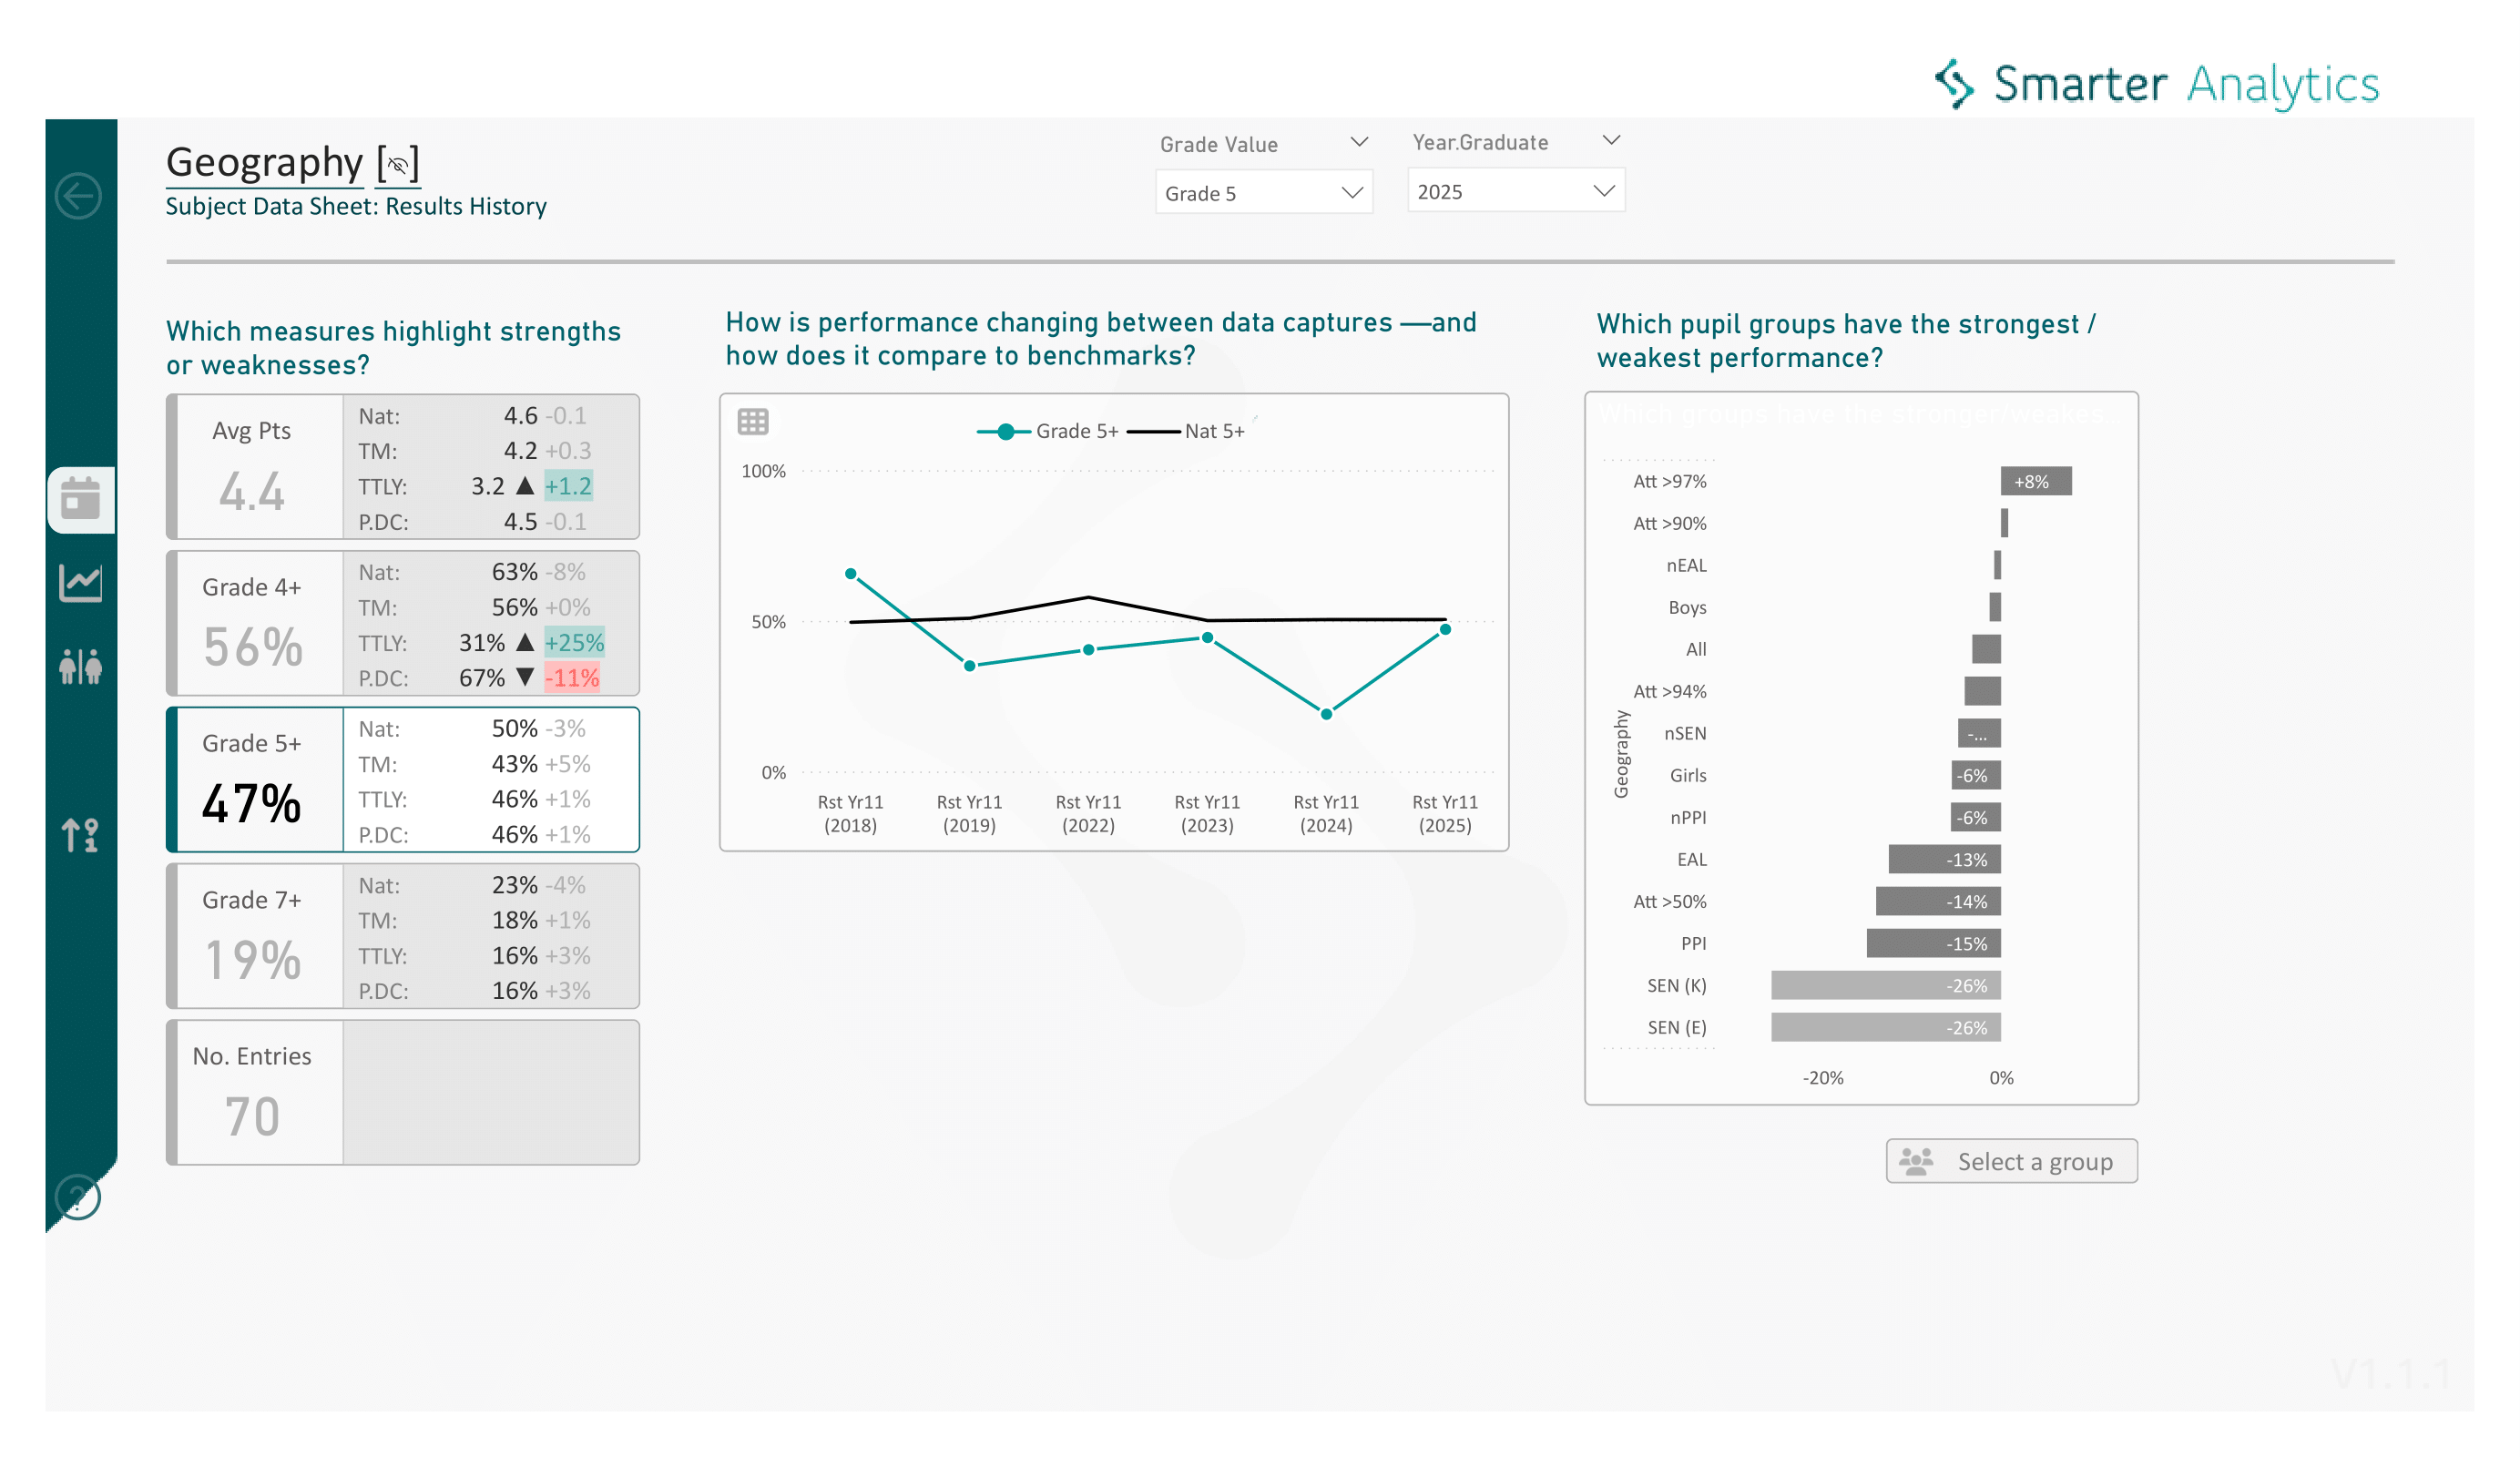
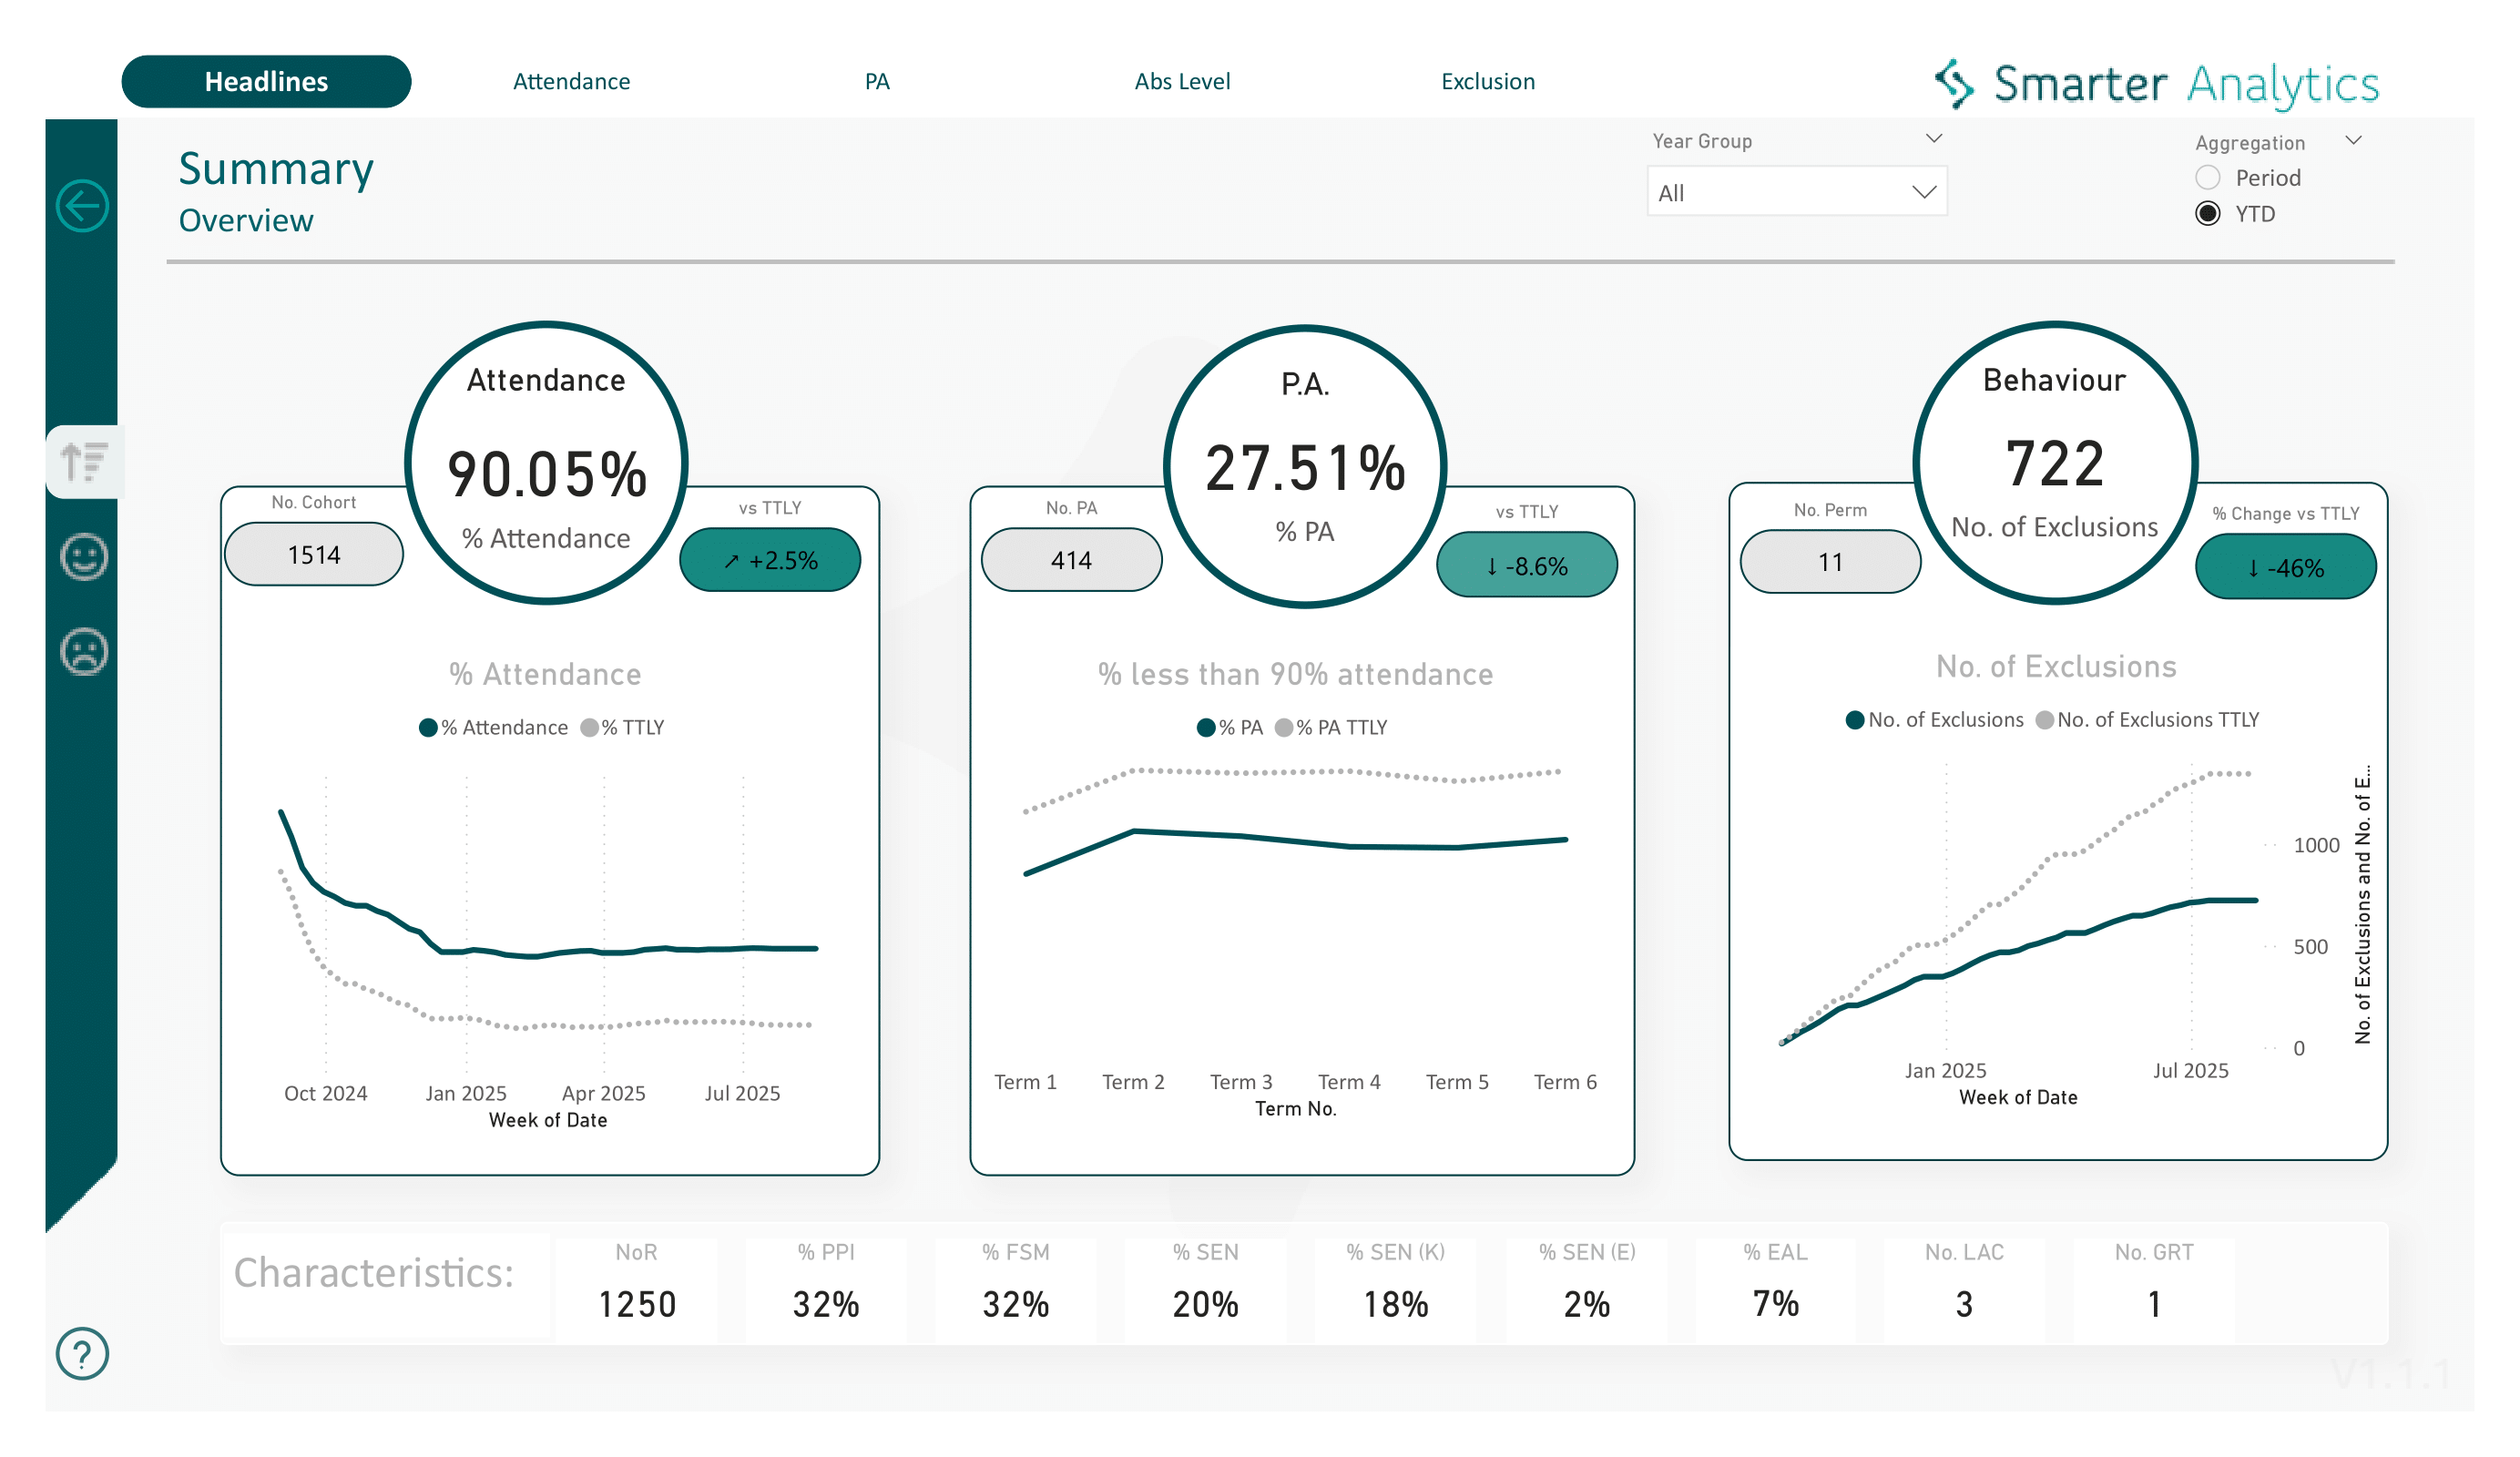
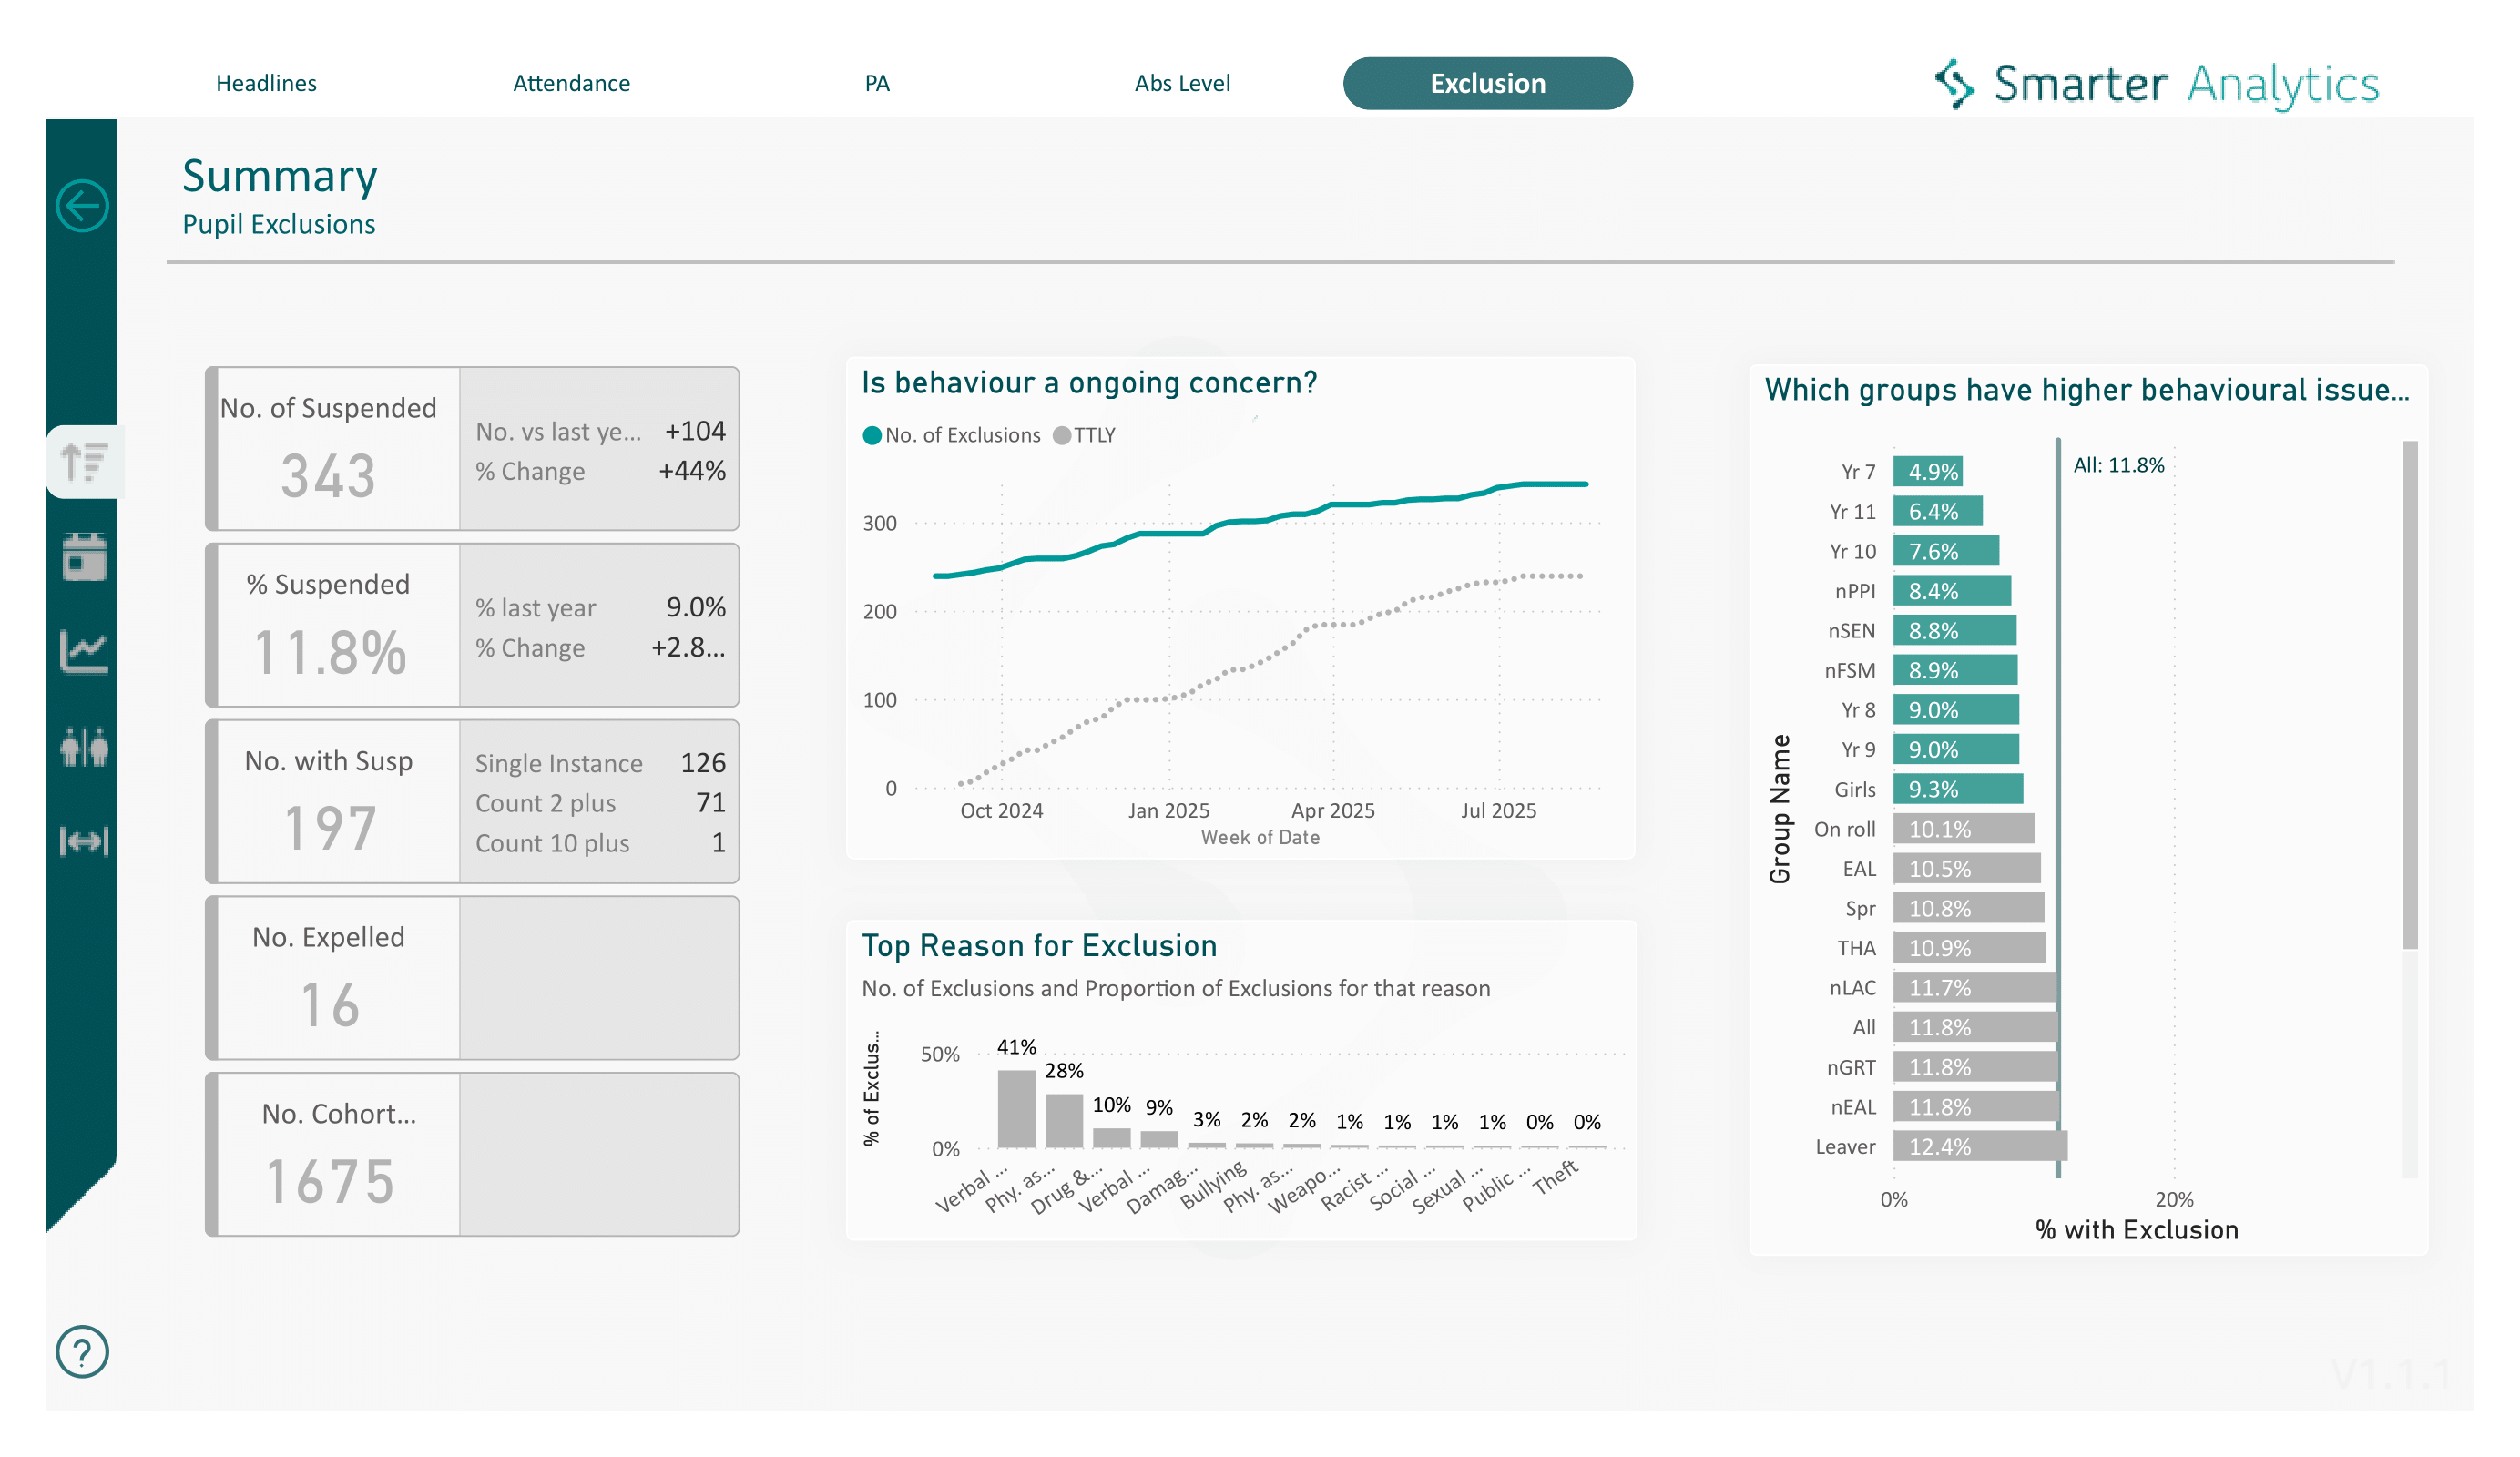
Spot persistent absence, link exclusions to outcomes, and identify patterns early — so no student slips through the cracks.
National Benchmarking
Consistent View
Pupil Target Lists
Track sanctions and rewards by cohort or subject, measure policy impact, and support positive behaviour across your school.
Spot behaviour patterns early
Measure impact by subject or cohort
Support positive behaviour consistently
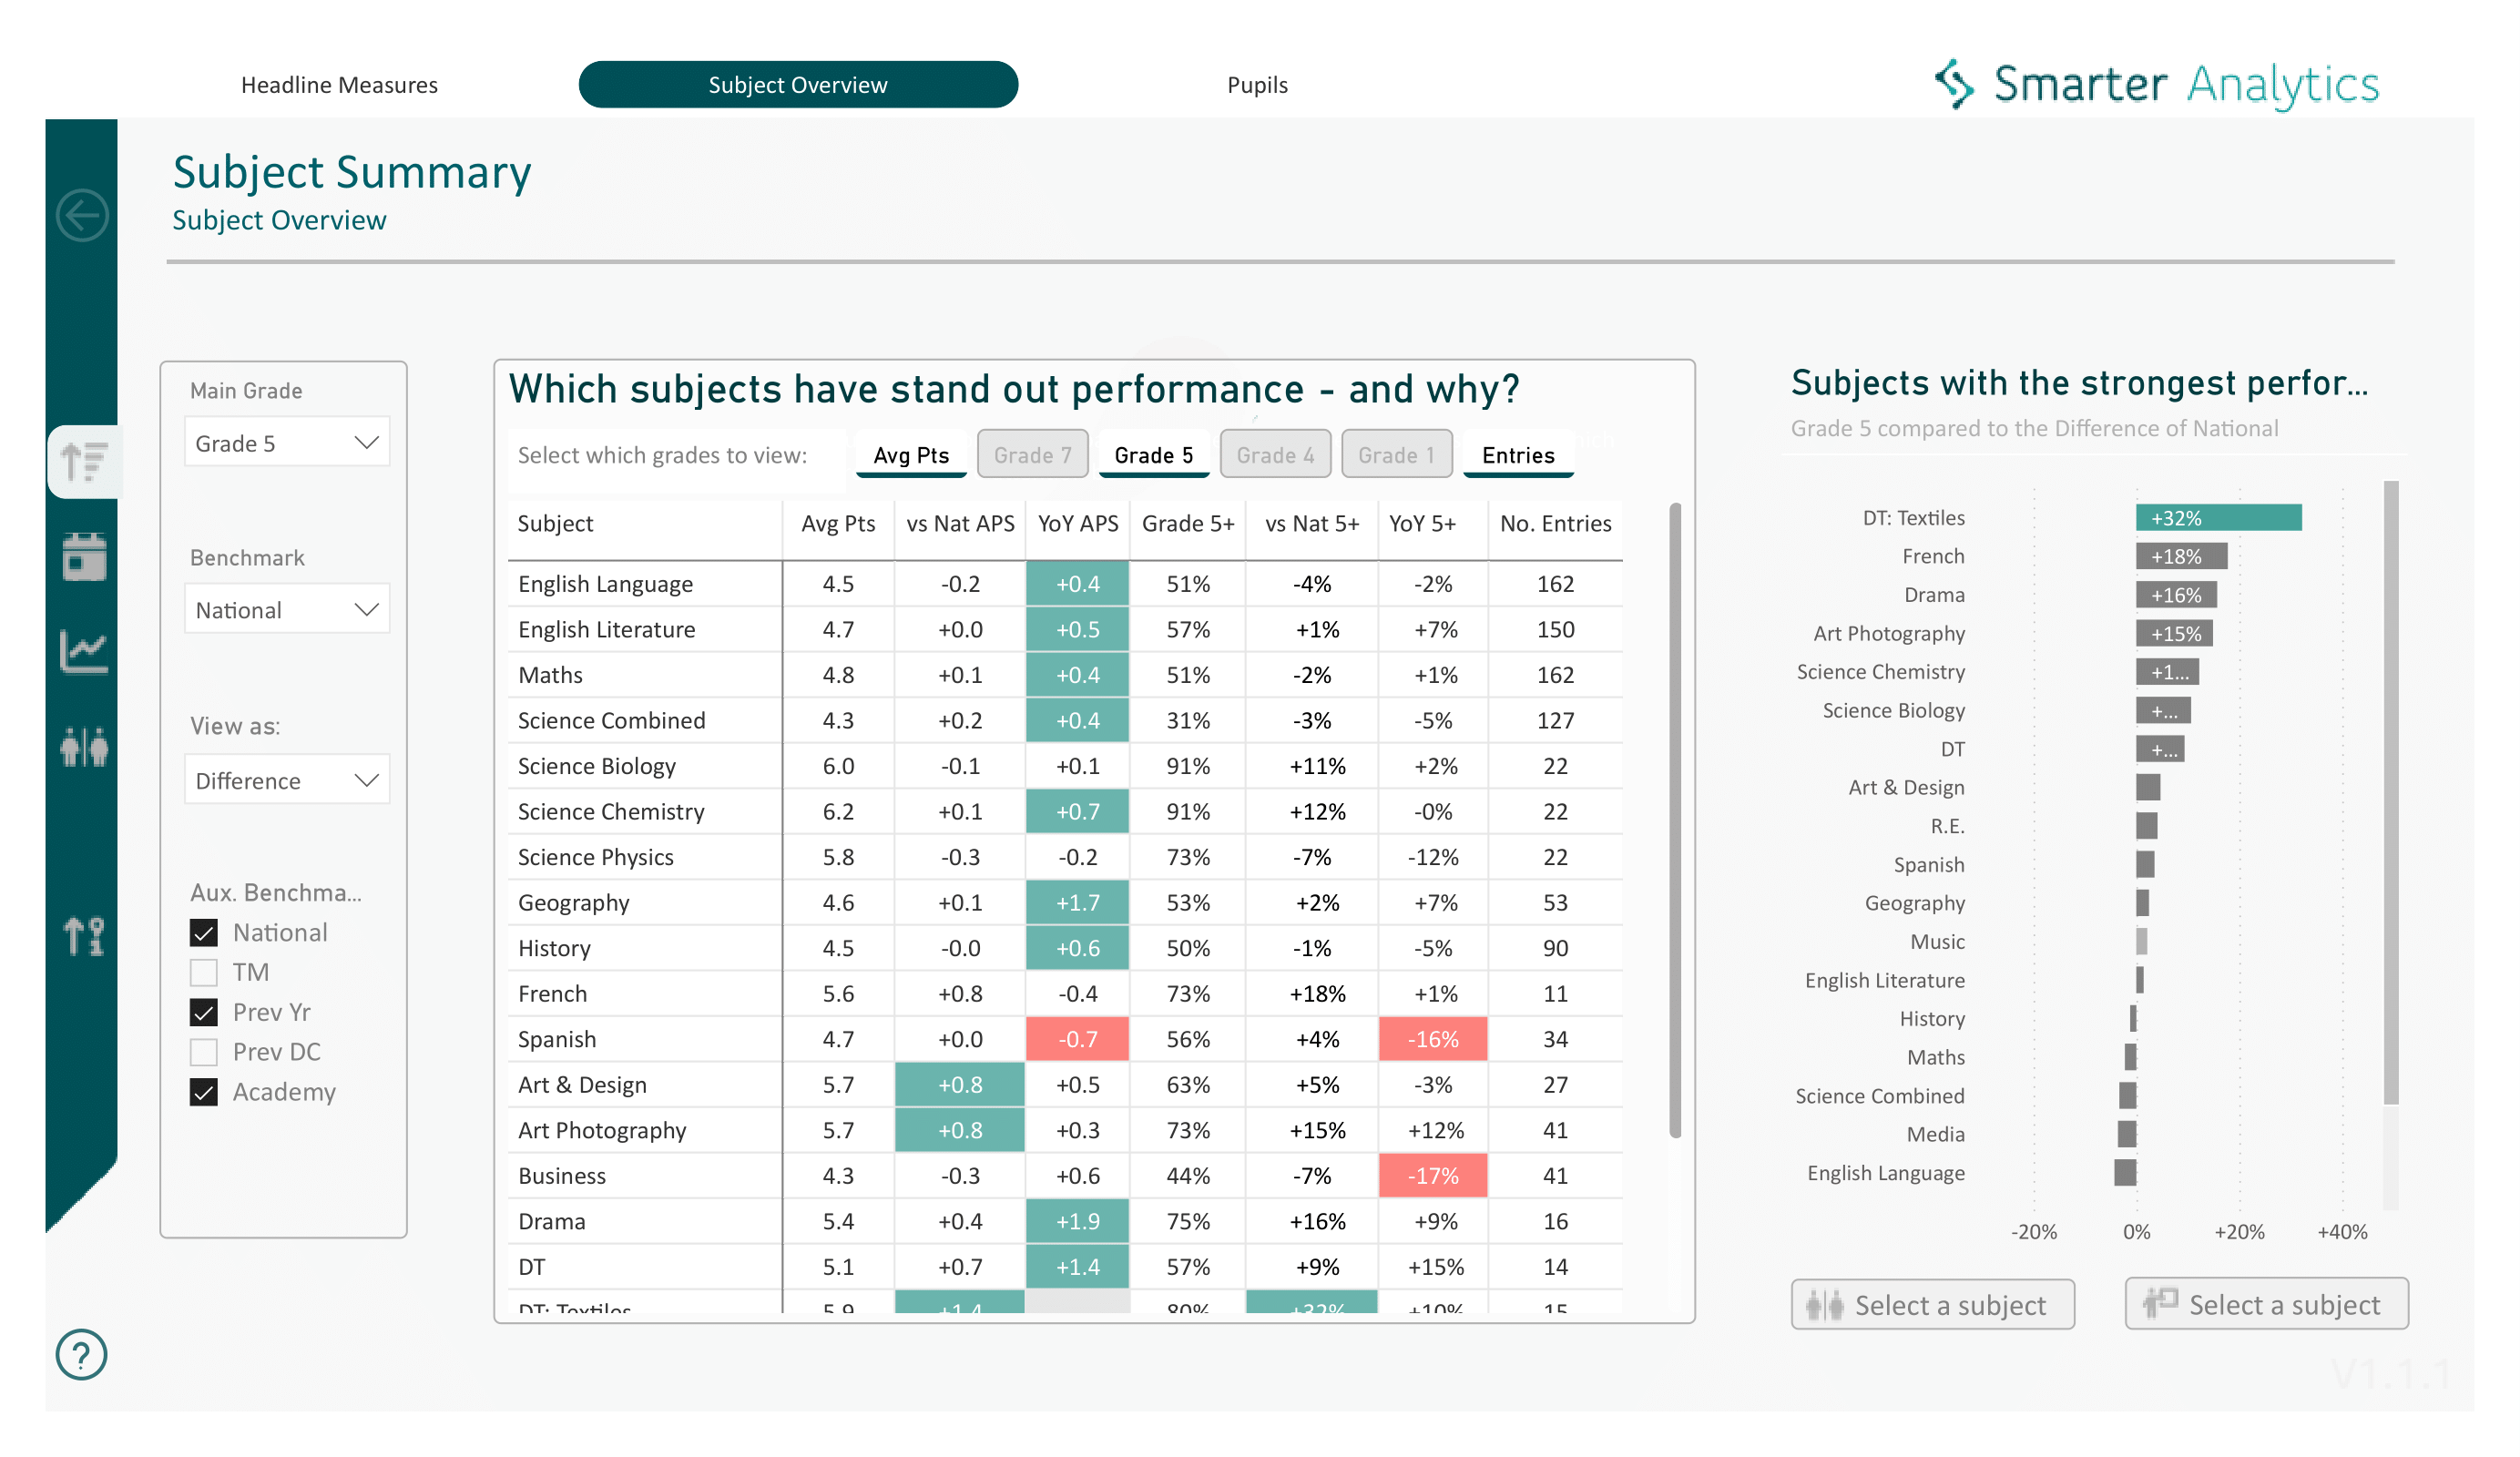
Connect outcomes with attendance and behaviour, drill from headline to group level, and diagnose causes — not just describe results.
National Benchmarking
Consistent View
Group Drilldown
Reports built with a teacher’s eye: clear, purposeful, guiding.
Smarter Analytics shows what matters most for your school — without the manual grind.